Top 5 Reasons to Use Power BI
Despite being released to the public on July 24, 2015, Power Bi is still an unfamiliar or new concept to many businesses. In this post we explore the top 5 reasons why to use Power Bi for business.
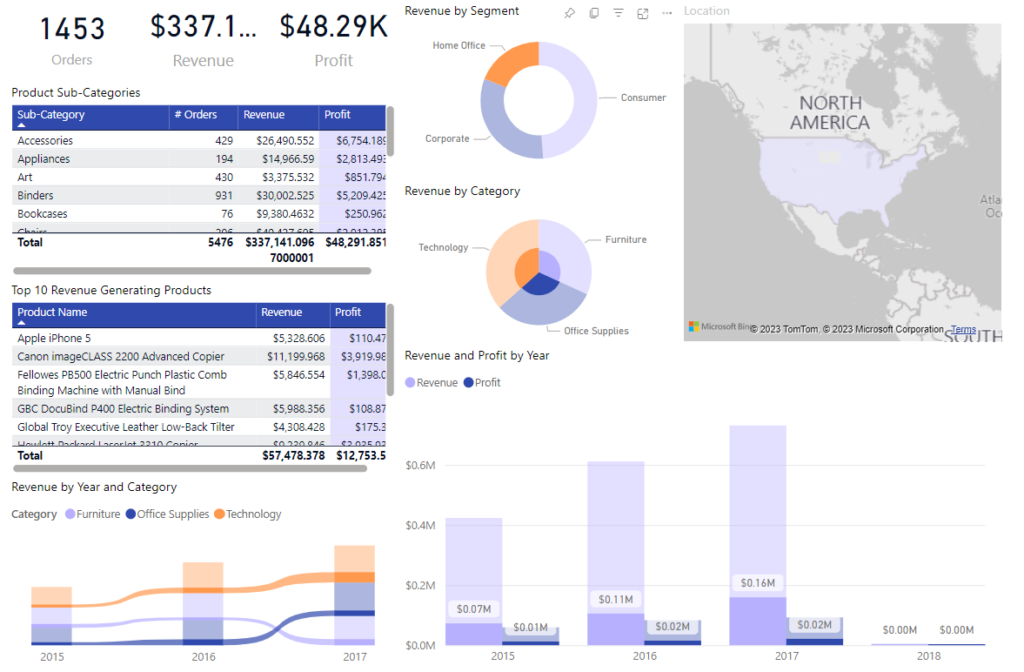
1. Visualise your Business Data
Represent your data through various visuals, including graphs, matrices and geographical maps. Your visuals can be customised to summarise your data by dimensions that mean the most to your business. This allows users to easily understand complex business data, to make informed, strategic decisions.
2. Interact with your Business Data
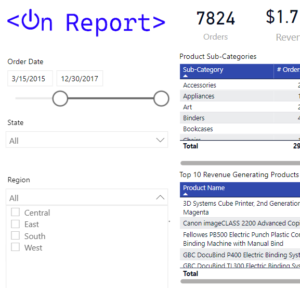
Interact with your data through the filtering, drill-through and drill down features.
Filtering, which occurs through ‘slicers’ or selecting dashboard data points, dynamically adjusts all other visuals in a dashboard.
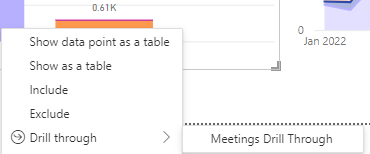
Drill-through functionality provides more detailed information for a specific data point in a report.
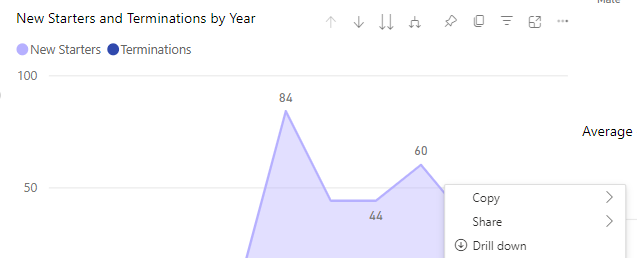
Drill-down functionality obtains a more granular level of detail for visuals in a dashboard.
The ability to interact with data can uncover key insights underlying business performance and other trends, which would otherwise remain hidden within aggregated data.
3. Securely Share your Data within your Organisation
Share specific reports with other users in your organisation. Power Bi allows for multiple users within your organisation. Your can assign your users specific user groups which will define their ability to access, edit and share reports. Ultimately, Power Bi is a collaborative tool, which provides organisation-wide benefits.
4. Import Data from Various Sources
You can Import data from various sources, for example Microsoft Excel, Microsoft Access, SQL Databases, Google Sheets, Third-Party APIs and many others. Your Power Bi service can be used to regularly refresh your data so that you can keep your Dashboards up to date. Furthermore, the online service settings can be configured to use existing security credentials for your data imports so that you organisation’s data can remain protected. As a result, Power Bi allows you to connect most data sources and keep reported information up to date.
5. Transform your Data in Many Ways
Power Bi allows you to transform imported data through Power Query M1 (Microsoft’s more original data transformation language) or DAX (Data Analysis Expressions). Your Data may lack the structure or richness to be readily presented in your intended reporting format. However, both Power Query M and DAX allow for your data to be cleansed, summarised, filtered, connected, and enriched through calculated fields or measures. Overall, you can easily your manipulate data to expand your reporting possibilities.
Useful Microsoft resources to learn more:
- What is a Power Query
- Learn DAX Basics
- Set Up Drill Through
- Drill mode in the service
- Roles in workspaces in Power BI
Other Blog Posts
- Paris 2024 Olympics Medal Count Dashboard
- IMDb Movie Ratings Dashboard
- Australian Bank Shares Dashboard
- Human Resources Dashboard

On Report
Helping businesses make data driven decisions through insightful business intelligence and reporting solutions