








Our Work

Explore real client projects, Power BI dashboards and data analytics solutions that showcase how we help Australian businesses make better decisions with their data.

TRUSTED BY BUSINESSES ACROSS AUSTRALIA

My Wealth Logo
Logo
Untitled design
01_LAWD_Logo_BlueNavy_RGB-1-1024x361
colabprojects_logo

PROOF & CREDIBILITY

Success Stories

Real Power BI reporting solutions delivering measurable business impact. At On Report, we’re proud to help businesses turn their data into clarity, confidence, and smarter decisions. Below, you’ll find real examples of how our dashboards and analytics solutions have made a measurable impact. Explore the stories to see what’s possible when your data starts working for you.

01
Power BI dashboards improving reporting accuracy and business visibility
Case study
Power BI, Azure SQL Database, Azure Data Factory
56

hours saved in manual

reporting per month

Problem
With a quickly expanding team and client base, the business required a solution to have better visibility over operations and performance. The existing spreadsheets, although well designed were beginning to show limitations of high manual effort and lack of visualisation capabilities.
Our Solution
To achieve better oversight of the business, we produced a solution that included a data warehouse and a Power BI reporting suite. Data from multiple systems is sent automatically to the data warehouse where it is easily accessible for reporting. The Power BI reports are then used to display this data in meaningful visuals that deliver key insights to both leadership and staff on demand.
Benefits
My Wealth Solutions now has complete oversight of their business operations and as a bonus the automated reporting solution saves days of manual reporting each month.
02
Custom Power BI reporting for financial services
Case study
Power BI, Azure SQL Database, Azure Data Factory
100%

lead and lag indicators

tracked for the first time

5+

data sources consolidated
into one dashboard

Problem
Centaur Financial Services have a proactive and forward-looking approach not only in advice but also in implementing business systems. They wanted to leverage their data to make better decisions based, have a better view of capacity and resourcing and have better insight into performance.
Our Solution
To achieve these goals, we implemented a solution that consisted of an Azure SQL data warehouse, ETL (Extract Transform Load) pipelines and a suite of Power BI reports. In this solution, data is automatically acquired from multiple sources via ETL pipelines and stored in a data warehouse in preparation for reporting. Power BI then visualises this information in a way that offers the required insights.
Benefits
The solution we put in place equips the business with integrated data and insightful visuals. This enables decisions based on data, oversight of capacity and resourcing, and an understanding of performance, achieving all objectives.
03
Power BI dashboards improving visibility and decision-making
Case study
Power BI, Azure SQL Database, Azure Data Factory
100%

manual Data Entry into
spreadsheets removed entirely

Problem
Whilst being leaders in insurance advice, Beaulife also have a highly innovative approach to technology and processes in their organisation. Having already implemented streamlined digital processes, the problem of truly tapping into their data was presented. The organisation had some reporting automations in place and had experimented with Power BI but engaged us to develop a more complete solution.
Our Solution
To tap into their digital data more effectively, we implemented a cloud-based data warehouse and a new set of professionally designed Power BI reports. With this solution, data is automatically acquired into the data warehouse via REST APIs and is presented in easy to decipher visuals in Power BI.
Benefits
With our solution the business can utilise their data to more effectively understand key aspects of their business such as new business, underwriting, insurance claims and revenue. Additionally, integrating Power BI with business applications reduced manual data entry in spreadsheets. Overall, the project was a success as it enabled higher return on investment in technology by harnessing business data.

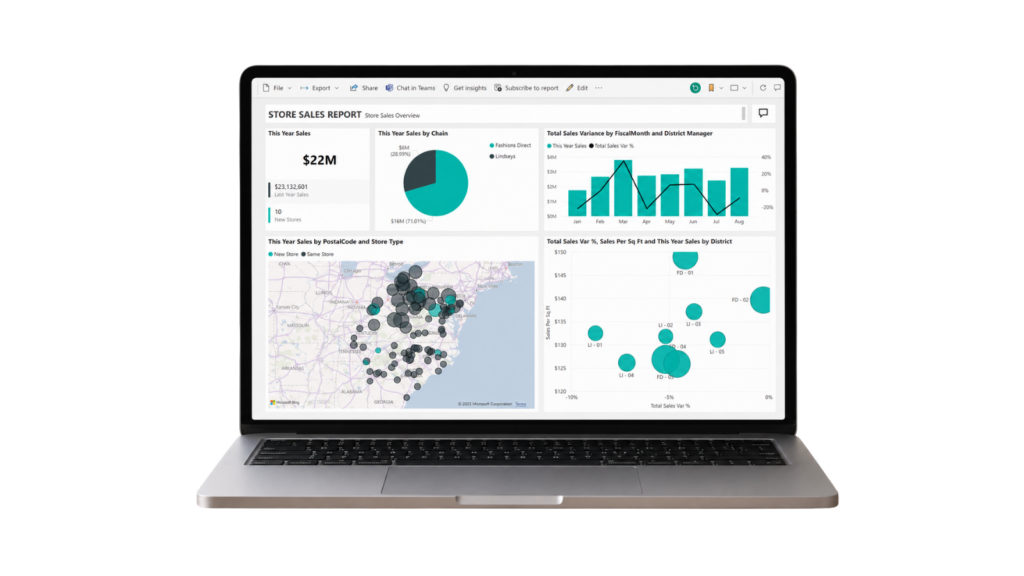
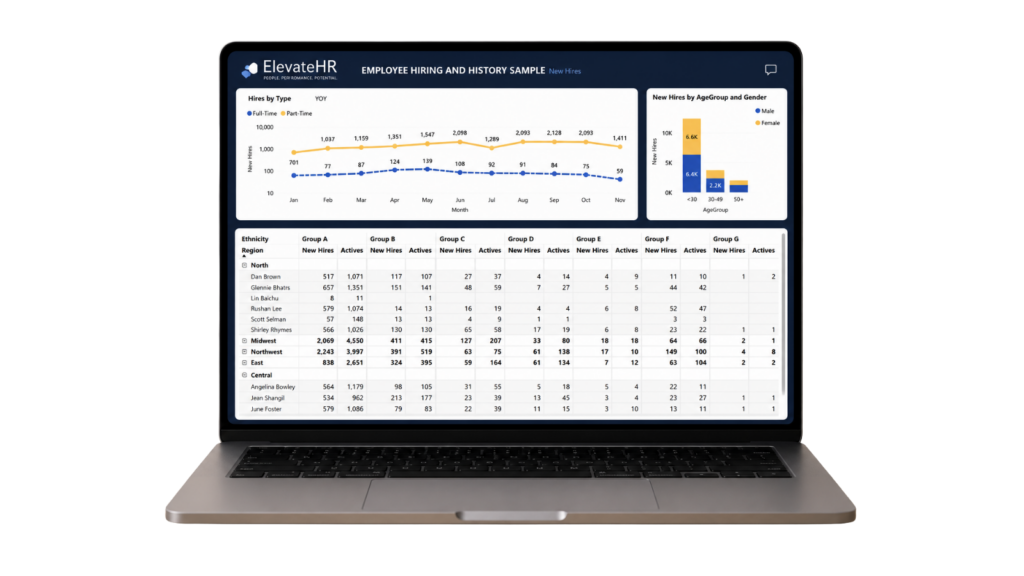
Our Power BI Dashboards

What we build for businesses

What Clients Say

My Wealth Solutions
My Wealth Solutions
We had a fantastic experience working with Lachlan from OnReport! He helped us collate our data and transform it into insightful and visually impressive Power BI dashboards. His expertise, attention to detail, and ability to translate complex data into meaningful reports made a huge difference for our business. Lachlan was professional, efficient, and a pleasure to work with throughout the process. Highly recommend his services to anyone looking for top-tier data analytics and reporting solutions!

Centaur Financial Services
We set out looking for ways to improve visibility and decision-making across our financial services business, and partnering with On Report to build out our Power BI reporting has been a game-changer. From the outset, their proposal was clear and focussed on outcomes. They delivered automated data refreshes, consolidated multiple data sources into one intuitive dashboard, and introduced drill-through functionality that gives us both a macro view as well as the ability to dive deep into specifics. What I value most is that the reporting now helps us measure and track the health of our business—not just lag measures, but lead indicators as well. It has also helped us cleanse our data by consistently identifying anomalies much faster than relying solely on our CRM. This improvement in data integrity has given us confidence in the decisions we make and supports operational excellence across the organisation. The dashboards are visually engaging, easy to navigate, and designed for usability across the entire team, which means we can extract insights quickly without technical complexity. Lachie's professionalism, responsiveness, and deep expertise in our source programs and Power BI have transformed how we use data to drive strategy and growth. If you're looking for a partner who can turn complex data into actionable insights, I highly recommend Lachie and On Report.

Beaulife
Beaulife
Working with Lachlan at OnReport has been a game-changer for our business. He took a tangled mix of data sources and turned them into clear, intuitive PowerBI dashboards that have completely transformed how we operate. We now have real visibility over our numbers, can make decisions faster, and have eliminated hours of manual admin each week. What stood out most was Lachlan's ability to quickly understand our workflow and design reporting that genuinely fits the way we run the business. The dashboards aren't just visually impressive they're practical, accurate, and built with real thought behind them. His communication was excellent, the process was seamless, and nothing was ever too much trouble. If you're looking for someone who can elevate your data and deliver reporting that actually moves the needle, we couldn't recommend Lachlan and OnReport more highly.

GET STARTED

Let's sort out your reporting.

Hi, I’m Lachlan, Director of On Report. If you’re tired of spreadsheets, clunky dashboards, or simply not having the data you need to track and grow your business — let’s talk.


Book a free 30-minute consult and we’ll figure out what better looks like for you.

30 minutes to explore your automation opportunities. No pitch, no pressure—just a focused conversation about your reporting challenges.

Schedule a discovery call

Tell us about your reporting goals, and we’ll tailor our expertise to fit your needs. Fill out the form below, and we’ll get back to you within 24 hours.